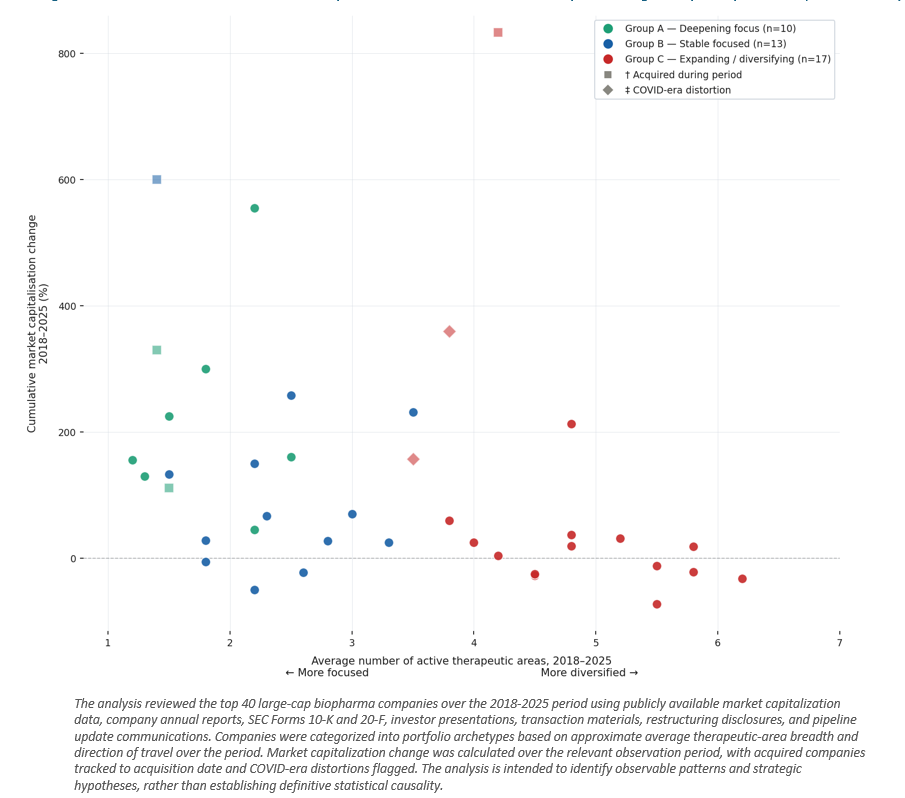
A surface reading of Figure 3 might suggest that narrow portfolios mechanically drive superior market performance. Asset quality, therapeutic-area exposure, timing, patent cliffs, and macro conditions all matter and contribute to the outcomes illustrated above. However, a closer, in-depth analysis of organizational dynamics surrounding companies within the respective portfolio archetypes demonstrates that portfolio coherence can serve as a visible benchmark for how mature a company’s strategic planning system may be. More importantly, we see that this performance pattern appears across a broad set of expanding companies facing different product, market, and leadership situations and circumstances. Assessment of public filings, investor presentations, annual reports, acquisition materials, restructuring disclosures, and pipeline update communications from the 2018-2025 period illustrates the following key takeaways across each organizational archetype:
Group A — Deepening Focus: Mature value realization systems are in place, structurally enforcing key priorities. Discipline is embedded in the architecture of the enterprise rather than dependent on leadership judgment; capital allocation thresholds, reallocation triggers, and prioritization criteria are defined in advance of potential external pressures. Several organizations in this group illustrate the compounding advantage of this approach. One leading organization established platform dominance in a core therapeutic area not through asset selection alone, but through sustained investment in scientific depth, manufacturing capability, and delivery infrastructure. Another concentrated capital in a single therapeutic domain through a period of significant market expansion, resisting the pull toward adjacent opportunities, and produced the organizational depth that enabled rapid commercial scaling when demand materialized. In both cases, the value was not created at the point of the asset. It was created by the planning system that governed the investment behind it in a consistent manner.
Group B — Stable Focused: These organizations demonstrate discipline in strategic planning, but several organizations are being led by asset performance rather than by a strategic planning system that would enforce focus independently of portfolio results. The vulnerability is structural: when a dominant asset reaches an inflection point (e.g., need of funding, a competitive threat requires reallocation of focus, or an investment thesis shifts) the governance model may not be proactively surfacing the required decision. One prominent organization exhibited a scenario where capital remained committed to a high-profile program long after clinical and regulatory evidence had materially shifted in a downward direction. This included contested approval pathways, coverage restrictions that limited patient access, and accelerated market intensity from competitive therapies. Reallocation ultimately occurred, but required new leadership and successive restructuring events, by which point the cost of the delay was already embedded in the organization’s market performance. By contrast, another organization in this group, operating with a broader therapeutic-area footprint than the Group A median, demonstrated that governance discipline can coexist with moderate portfolio breadth when capital is deliberately concentrated behind platform-level opportunities. Its sustained investment in targeted therapeutic platforms was maintained through periods of external pressure, leading to reduced R&D spend as well as compounded competitive advantage and positive increase in market capitalization performance that substantially exceeded the Group B median. The distinction within this group is not portfolio breadth, but whether governance is structurally enforcing intent or relying on performance to drive strategic decisions.
Group C — Expanding / Diversifying: Strategic planning system maturity that has not kept pace with portfolio complexity. Although both the average and median change in market capitalization performance are lower vs. other organizational archetypes, the narrative is not driven by poor strategic intent. Most of these organizations articulated coherent rationales for their portfolio expansion efforts. What the data reflects is the accumulated cost of a strategic planning system that was unable to govern the commitments it has taken on with the rigor that value realization requires. One organization in this group had new leadership brought into a governance structure that possessed multiple approval levels and layers to successfully execute routine operational decisions. This was a visible symptom of a planning system that had lost the ability to enforce prioritization at a pace that was suitable for a larger, more complex organization. Another large organization maintained a portfolio of strong scientific value across multiple therapeutic areas, but lacked the prioritization capabilities that would allow its strategic planning activities to concentrate investment behind its highest-conviction programs; this produced what external analysts consistently described as “breadth without strategic coherence”. More broadly across this group, there were numerous instances where commitments were added without an explicit corresponding de-prioritization elsewhere; this resulted in a structural burden to compete for capital and capacity, with reallocation efforts driven from external events rather than proactively enforced by strategic governance itself.
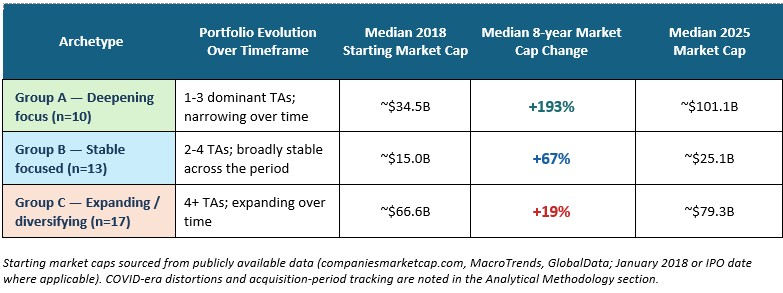
A collective review of enterprise value differentials across organizational archetypes illustrates the full scale of what is at stake. The median Group C (Expanding / Diversifying) organization started the 2018 period at ~$66.6B in market capitalization yet generated only a +19% return over the following eight years. Had the same organization compounded at the Group B (Stable Focused) median rate of +67%, it would have ended the period at ~$111B, representing ~$32B in foregone enterprise value per median company. Across all 17 Group C organizations, the aggregate foregone market capitalization versus the Group B benchmark is estimated at ~$769B based on individual company-level analysis.